What these worksheets practise
A straight line on a grid can be described by two numbers: how steep it is (the slope, ) and where it crosses the -axis (the y-intercept, ). Together they give the equation . Every problem is printed on its own coordinate grid from to , and every point you need sits exactly on a grid corner.
- Easy — find the slope of the line through two marked points.
- Medium — graph a line given as . The answer sheet shows each correct graph.
- Hard — write the equation of a line drawn on the grid.
The steps below start with plotting a single point. Steps 1–3 are enough for Easy worksheets, step 4 is for Medium and step 5 for Hard.
Watch: slope, y = mx + b and graphing a line (3:43)
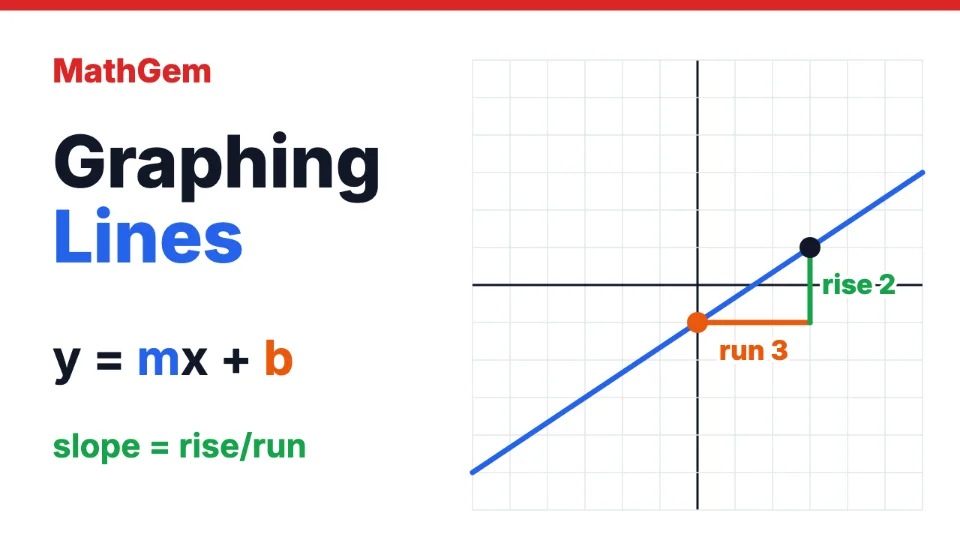
Read the transcript
Let's learn how to graph a straight line, and how to write its equation.
A point (x, y) is reached from the origin, the center of the grid. Move x squares right, or left if negative, then y squares up, or down if negative. (3, 2) is 3 right and 2 up. (−4, 1) is 4 left and 1 up. (0, −5) is not left or right at all, just 5 down.
Slope tells how steep a line is. Going from one point to another, count the rise, up or down, and the run, to the right. Slope is rise over run. From (1, 2) to (4, 8), the rise is 8 − 2 = 6 and the run is 4 − 1 = 3. So m = 6/3 = 2. A line that goes down as you move right has a negative slope. From (0, 4) to (2, 0), the rise is −4 and the run is 2, so m = −2. A flat line has slope 0.
Rise and run don't have to divide evenly. From (−4, 1) to (2, 4), the rise is 3 and the run is 6, so m = 3/6 = 1/2: up 1 for every 2 to the right. You can start from either point, as long as you subtract in the same order on top and bottom: 1 − 4 = −3 and −4 − 2 = −6, and −3/−6 is still 1/2.
In y = mx + b, the number b is where the line crosses the y-axis, at the point (0, b), and m is the slope. To graph y = 2/3 x − 1, start at (0, −1). The slope 2/3 means up 2 for every 3 to the right. That lands on (3, 1), then (6, 3). Going the other way, down 2 for every 3 to the left, gives (−3, −3). Join the points with a ruler. To check, put a point into the equation. For x = 3, two thirds of 3 is 2, and 2 − 1 = 1. That matches (3, 1).
Now work backwards, from a graph to its equation. Read b where the line crosses the y-axis: here at (0, −3), so b = −3. The line also passes through (3, −5). The rise is −5 − (−3) = −2 and the run is 3, so m = −2/3. So the equation is y = −2/3 x − 3. Check with the point (3, −5): negative two thirds of 3 is −2, and −2 − 3 = −5. It fits.
Watch out for these common mistakes. Run over rise. From (0, 0) to (4, 2), the slope is 2/4 = 1/2, not 2. The rise goes on top. Subtracting in different orders: (8 − 2) over (1 − 4) gives −2 instead of 2. Take both differences from the same point. Starting at (b, 0). For y = 2x + 3, the line starts at (0, 3) on the y-axis, not at (3, 0). A negative slope drawn uphill. For y = −2x + 1, each step right goes 2 down. Negative slopes fall from left to right.
Practise with free graphing lines worksheets and answer keys at mathgem.ca.
Worked examples, one step at a time
Step 1: plotting a point
A point is reached from the center of the grid, the origin: move squares right (left if negative), then squares up (down if negative). is 3 right and 2 up; is 4 left and 1 up; is not left or right at all, just 5 down.
Step 2: slope is rise over run
To go from one point of a line to another, count how far you move up or down (the rise) and how far you move right (the run). The slope is rise divided by run. From to the rise is and the run is :
A line that goes down as you move right has a negative slope. From to : . A flat line has slope 0.
Step 3: slopes that are fractions
Rise and run do not have to divide evenly. From to the rise is 3 and the run is 6, so : the line goes up 1 for every 2 to the right. It does not matter which point you start from, as long as you subtract in the same order on top and bottom:
Step 4: graphing
In , the number is where the line crosses the -axis, at the point , and is the slope. To graph : start at . The slope means up 2 for every 3 to the right, which lands on , then . Going the other way, down 2 for every 3 to the left, gives . Join the points with a ruler.
To check, put a plotted point into the equation: for , , which matches the point .
Step 5: writing the equation from a graph
Work backwards. Read where the line crosses the -axis, then find the slope from two marked points. If a line crosses the -axis at and also passes through , the rise is and the run is 3:
Check your answers
Every marked point must satisfy the equation. For : . If one point does not fit, the slope or the intercept is wrong.
Common mistakes
- Run over rise. Slope is the vertical change on top: from to the slope is , not 2.
- Subtracting in different orders. gives instead of 2. Take both differences from the same point.
- Starting at . The intercept is on the -axis, the vertical one: for the line starts at , not .
- A negative slope drawn uphill. For , each step right goes 2 down. A quick look at the finished line catches this: negative slopes fall from left to right.
Sample problems
These problems come from the same generator as the worksheet above, two at each difficulty level. Press Generate for a fresh set.
Easy
- Find the slope of the line through and .
- Find the slope of the line through and .
Medium
- Graph the line .
- Graph the line .
Hard
- Write the equation of the line, in the form .
- Write the equation of the line, in the form .
Show answers
Tips for teachers and parents
- Have students mark at least three points before drawing a line. If they do not line up, one of them is wrong.
- Drawing the rise and run as two arrows, one up or down and one across, makes the slope visible on Easy worksheets.
- The same idea of a constant rate appears in ratios and proportions: a slope of is a ratio of 2 to 3.